Visualizes mutations across aligned sequences by displaying only positions that differ from a reference sequence. Accepts either a data frame with sequences (which are aligned internally using Needleman-Wunsch global alignment) or a pre-aligned Clustal file. Supports character coloring and region highlighting (e.g., CDRs, tags, binding sites). Useful for focusing on differences in sequence comparisons. Inspired by Jalview's behavior when setting a reference sequence and hiding matching positions.
Usage
gg_seqdiff(
  data,
  ref,
  sequence = "sequence",
  name = NULL,
  clustal = NULL,
  color = NULL,
  highlight = NULL,
  wrap = NULL,
  size = 3,
  show_ref = TRUE,
  margin_t = 30,
  annotate = NULL,
  annotate_defaults = list(angle = 0, vjust = 0.5, size = 3, face = "plain", color =
    "black")
)
Arguments
- data
A data frame containing sequences.
- ref
Character string of the reference sequence against which sequences will be aligned.
- sequence
Character string specifying the column name in
datathat contains the sequences. Default is "sequence".- name
Character string specifying the column name in
datathat contains names/IDs for the sequences. If NULL (default), no names are shown on the y-axis. If specified, these names will be displayed instead of blank labels. Note: If the same sequence appears multiple times indatawith different names, only the first occurrence's name will be used in the plot.- clustal
Character string specifying path to a Clustal alignment file. If provided, overrides
data,ref,sequence, andname. Default is NULL.- color
Named character vector of colors for specific characters, or NULL (default). If NULL, all characters are displayed in black. Characters specified here are automatically displayed in bold. Example:
c(K = "blue", R = "red").- highlight
Named list where names are valid R colors and values are numeric vectors of positions to highlight with vertical shading. The shading spans the full height of the plot with semi-transparent color (alpha = 0.3) and black borders. Consecutive positions are automatically merged into continuous bands. To specify multiple regions with the same color, provide them as a single vector:
list("#FFE0B2" = c(1:10, 50:60)). Default is NULL (no highlighting).- wrap
Numeric value specifying the maximum number of positions to display per row before wrapping to the next panel. If NULL (default), no wrapping is applied and the entire sequence is displayed in a single row. When specified, the plot is split into multiple vertically stacked panels, each showing up to
wrappositions. Useful for displaying long sequences in a more compact format.- size
Numeric value for the size of sequence characters. Default is 3.
- show_ref
Logical indicating whether to show the reference sequence in the plot. Default is TRUE.
- margin_t
Numeric value for the top margin in points. Increases space above the plot to prevent annotation clipping. Adjust this value upward if rotated annotations are cut off. Default is 30.
- annotate
List of annotation specifications to add text labels above the plot. Each element must be a list with required elements
label(character string) andpos(numeric position). Optional elements:angle(rotation angle),hjust(horizontal justification, defaults to 0 for 90-degree angles and 0.5 for other angles),vjust(vertical justification),size(text size),face(font face),color(text color). Default is NULL (no annotations).- annotate_defaults
List of default values for annotation styling. Valid elements:
angle(default 0),vjust(default 0.5),size(default 3),face(default "plain"),color(default "black"). These defaults are used when individual annotations don't specify these parameters. Default islist(angle = 0, vjust = 0.5, size = 3, face = "plain", color = "black").
Value
A ggplot2 object showing the aligned sequences with differences highlighted. The plot displays:
Each sequence on a separate row
Actual characters for positions that differ from the reference
Optional reference sequence at the top (if
show_ref = TRUE)Specified characters highlighted in bold with custom colors
Optional vertical shading bands at specified positions
Optional text annotations above the plot
If no valid sequences are found, returns an empty ggplot2 object with a message.
Details
The function aligns each sequence to the reference using Needleman-Wunsch global alignment, then displays only differences. Positions matching the reference are not displayed to reduce visual clutter and emphasize mutations. Gaps from alignment are also shown as dashes.
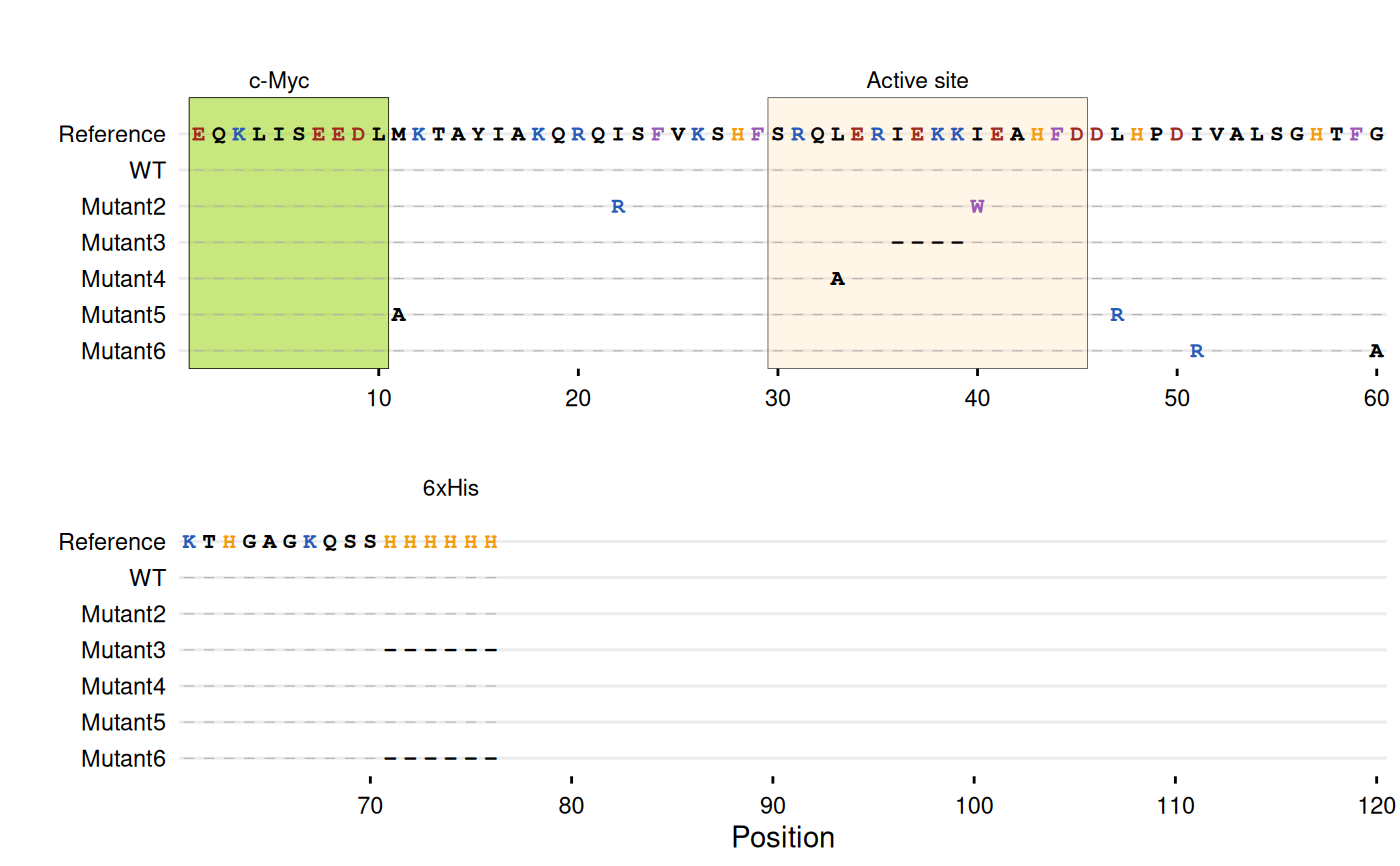
Examples
# -----------------------------------------------------------------------
# Example with Clustal alignment file
# -----------------------------------------------------------------------
# Create a temporary Clustal file
clustal_file <- tempfile(fileext = ".aln")
writeLines(c(
"CLUSTAL W (1.83) multiple sequence alignment",
"",
"WT EQKLISEEDLMKTAYIAKQRQISFVKSHFSRQLERIEKKIEAHFDDLHP",
"Mutant1 EQKLISEEDLMKTAYIAKQRQISFVKSHFSRQLERIEKKIEAHFDDLHP",
"Mutant2 EQKLISEEDLMKTAYIAKQRQRSFVKSHFSRQLERIEKKWEAHFDDLHP",
"Mutant3 EQKLISEEDLMKTAYIAKQRQISFVKSHFSRQLER----IEAHFDDLHP",
"Mutant4 EQKLISEEDLMKTAYIAKQRQISFVKSHFSRQAERIEKKIEAHFDDLHP",
"Mutant5 EQKLISEEDLAKTAYIAKQRQISFVKSHFSRQLERIEKKIEAHFDDRHP",
"Mutant6 EQKLISEEDLMKTAYIAKQRQISFVKSHFSRQLERIEKKIEAHFDDLHP",
" *********** ***************** * ******* *******:**",
"",
"WT DIVALSGHTFGKTHGAGKQSSHHHHHH",
"Mutant1 DIVALSGHTFGKTHGAGKQSSHHHHHH",
"Mutant2 DIVALSGHTFGKTHGAGKQSSHHHHHH",
"Mutant3 DIVALSGHTFGKTHGAGKQSS------",
"Mutant4 DIVALSGHTFGKTHGAGKQSSHHHHHH",
"Mutant5 DIVALSGHTFGKTHGAGKQSSHHHHHH",
"Mutant6 DRVALSGHTFAKTHGAGKQSS------",
" * ******** ********** "
), clustal_file)
# Plot Clustal alignment
gg_seqdiff(
clustal = clustal_file,
ref = paste0("EQKLISEEDLMKTAYIAKQRQISFVKSHFSRQLERIEKKIEAHFDDLHP",
"DIVALSGHTFGKTHGAGKQSSHHHHHH"),
color = c(K = "#285bb8", R = "#285bb8", # Basic
E = "#a12b20", D = "#a12b20", # Acidic
W = "#9b59b6", F = "#9b59b6", # Aromatic
H = "#f39c12"), # Histidine
highlight = list(
"#94d104" = 1:10, # N-terminal c-Myc tag
"#FFE0B2" = 30:45, # Active site
"#94d104" = 72:77 # C-terminal His-tag
),
annotate = list(
list(label = "c-Myc", pos = 5),
list(label = "Active site", pos = 37),
list(label = "6xHis", pos = 74)
),
wrap = 60
)
 # Clean up
unlink(clustal_file)
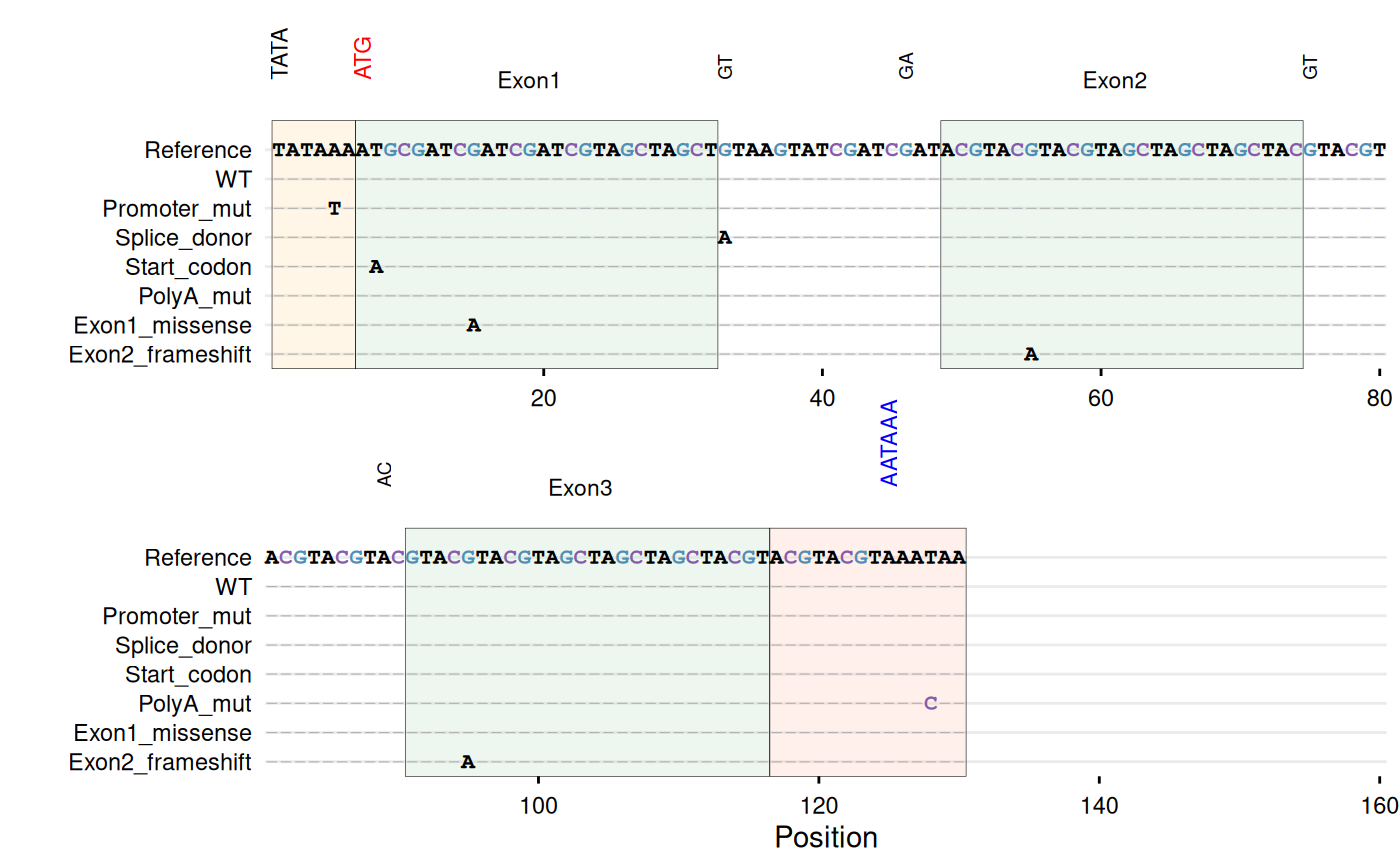
# -----------------------------------------------------------------------
# Example with DNA sequences - gene structure with regulatory elements
# -----------------------------------------------------------------------
dna_ref <- paste0(
"TATAAA", # TATA box (promoter)
"ATGCGATCGATCGATCGTAGCTAGCT", # Exon 1
"GTAAGTATCGATCGAT", # Intron 1 (splice sites: GT...AG)
"ACGTACGTACGTAGCTAGCTAGCTAC", # Exon 2
"GTACGTACGTACGTAC", # Intron 2
"GTACGTACGTAGCTAGCTAGCTACGT", # Exon 3
"ACGTACGTAAATAA" # 3'UTR with poly-A signal
)
dna_df <- data.frame(
sequence = c(
dna_ref,
sub("TATAAA", "TATATA", dna_ref),
gsub("GTAAGT", "ATAAGT", dna_ref),
gsub("CGATAG", "CGATAA", dna_ref),
sub("ATG", "AAG", dna_ref),
gsub("AATAA$", "AACAA", dna_ref),
sub("GCGATCGATCGATCG", "GCGATCAATCGATCG", dna_ref),
gsub("ACGTACGTACGTAG", "ACGTACATACGTAG", dna_ref)
),
id = c("WT", "Promoter_mut", "Splice_donor",
"Splice_acceptor", "Start_codon", "PolyA_mut",
"Exon1_missense", "Exon2_frameshift")
)
# Highlight gene structure elements
gg_seqdiff(
data = dna_df,
ref = dna_ref,
name = "id",
color = c(G = "#4e8fb5", C = "#845cab"),
highlight = list(
"#FFE0B2" = 1:6, # TATA box (promoter)
"#C8E6C9" = c(7:32, 49:74, 91:116), # Exons
"#FFCCBC" = 117:130 # 3'UTR with poly-A
),
annotate = list(
list(label = "TATA", pos = 1, angle = 90),
list(label = "ATG", pos = 7, angle = 90, color = "red"),
list(label = "Exon1", pos = 19),
list(label = "GT", pos = 33, angle = 90, size = 2.5),
list(label = "GA", pos = 46, angle = 90, size = 2.5),
list(label = "Exon2", pos = 61),
list(label = "GT", pos = 75, angle = 90, size = 2.5),
list(label = "AC", pos = 89, angle = 90, size = 2.5),
list(label = "Exon3", pos = 103),
list(label = "AATAAA", pos = 125, angle = 90, color = "blue")
),
wrap = 80
)
# Clean up
unlink(clustal_file)
# -----------------------------------------------------------------------
# Example with DNA sequences - gene structure with regulatory elements
# -----------------------------------------------------------------------
dna_ref <- paste0(
"TATAAA", # TATA box (promoter)
"ATGCGATCGATCGATCGTAGCTAGCT", # Exon 1
"GTAAGTATCGATCGAT", # Intron 1 (splice sites: GT...AG)
"ACGTACGTACGTAGCTAGCTAGCTAC", # Exon 2
"GTACGTACGTACGTAC", # Intron 2
"GTACGTACGTAGCTAGCTAGCTACGT", # Exon 3
"ACGTACGTAAATAA" # 3'UTR with poly-A signal
)
dna_df <- data.frame(
sequence = c(
dna_ref,
sub("TATAAA", "TATATA", dna_ref),
gsub("GTAAGT", "ATAAGT", dna_ref),
gsub("CGATAG", "CGATAA", dna_ref),
sub("ATG", "AAG", dna_ref),
gsub("AATAA$", "AACAA", dna_ref),
sub("GCGATCGATCGATCG", "GCGATCAATCGATCG", dna_ref),
gsub("ACGTACGTACGTAG", "ACGTACATACGTAG", dna_ref)
),
id = c("WT", "Promoter_mut", "Splice_donor",
"Splice_acceptor", "Start_codon", "PolyA_mut",
"Exon1_missense", "Exon2_frameshift")
)
# Highlight gene structure elements
gg_seqdiff(
data = dna_df,
ref = dna_ref,
name = "id",
color = c(G = "#4e8fb5", C = "#845cab"),
highlight = list(
"#FFE0B2" = 1:6, # TATA box (promoter)
"#C8E6C9" = c(7:32, 49:74, 91:116), # Exons
"#FFCCBC" = 117:130 # 3'UTR with poly-A
),
annotate = list(
list(label = "TATA", pos = 1, angle = 90),
list(label = "ATG", pos = 7, angle = 90, color = "red"),
list(label = "Exon1", pos = 19),
list(label = "GT", pos = 33, angle = 90, size = 2.5),
list(label = "GA", pos = 46, angle = 90, size = 2.5),
list(label = "Exon2", pos = 61),
list(label = "GT", pos = 75, angle = 90, size = 2.5),
list(label = "AC", pos = 89, angle = 90, size = 2.5),
list(label = "Exon3", pos = 103),
list(label = "AATAAA", pos = 125, angle = 90, color = "blue")
),
wrap = 80
)
 # -----------------------------------------------------------------------
# Example with antibody sequences with CDR mutations
# -----------------------------------------------------------------------
ref_seq <- paste0(
"QVQLVESGGGLVQAGGSLRLSCAASGRTFSSYAMGWFRQAPGKEREFVAAINSGGSTYYP",
"DSVKGRFTISRDNAKNTVYLQMNSLKPEDTAVYYCAADLRGTTVKDYWGQGTQVTVSSEQKLISEEDL"
)
# All sequences must be same length as reference
mutant_df <- data.frame(
sequence = c(
ref_seq, # Wild-type
# CDR1 mutations (27-33)
sub("GRTFSSYAMG", "GRTASSYAMG", ref_seq),
# CDR2 mutations (51-57)
sub("AINSGGS", "AINSAGS", ref_seq),
# CDR3 mutations (96-107)
sub("AADLRGTTVKDY", "AADLRGTTAKDY", ref_seq),
# Framework mutations
sub("QVQLVES", "EVQLVAS", ref_seq),
# Multiple CDR mutations
sub("AADLRGTTVKDY", "AADWRGTTVKDY",
sub("GRTFSSYAMG", "GYTASSAAMG", ref_seq))
),
id = c("WT", "CDR1_F30A", "CDR2_G54A", "CDR3_V104A",
"FR1_E5A", "CDR1+3_multi")
)
# Highlight CDRs and tags, color key residues
gg_seqdiff(
data = mutant_df,
ref = ref_seq,
name = "id",
color = c(R = "#285bb8", K = "#285bb8", # positive
E = "#a12b20", D = "#a12b20", # negative
W = "#9b59b6", F = "#9b59b6"), # aromatic
highlight = list(
"#70bcfa" = 1, # N-terminal
"#ffb4b4" = c(27:33, 51:57, 96:107), # CDRs
"#94d104" = 119:128 # c-Myc tag
),
annotate = list(
list(label = "N-term", pos = 1, angle = 90),
list(label = "CDR1", pos = 30),
list(label = "CDR2", pos = 54),
list(label = "CDR3", pos = 102),
list(label = "c-Myc", pos = 123)
),
wrap = 66
)
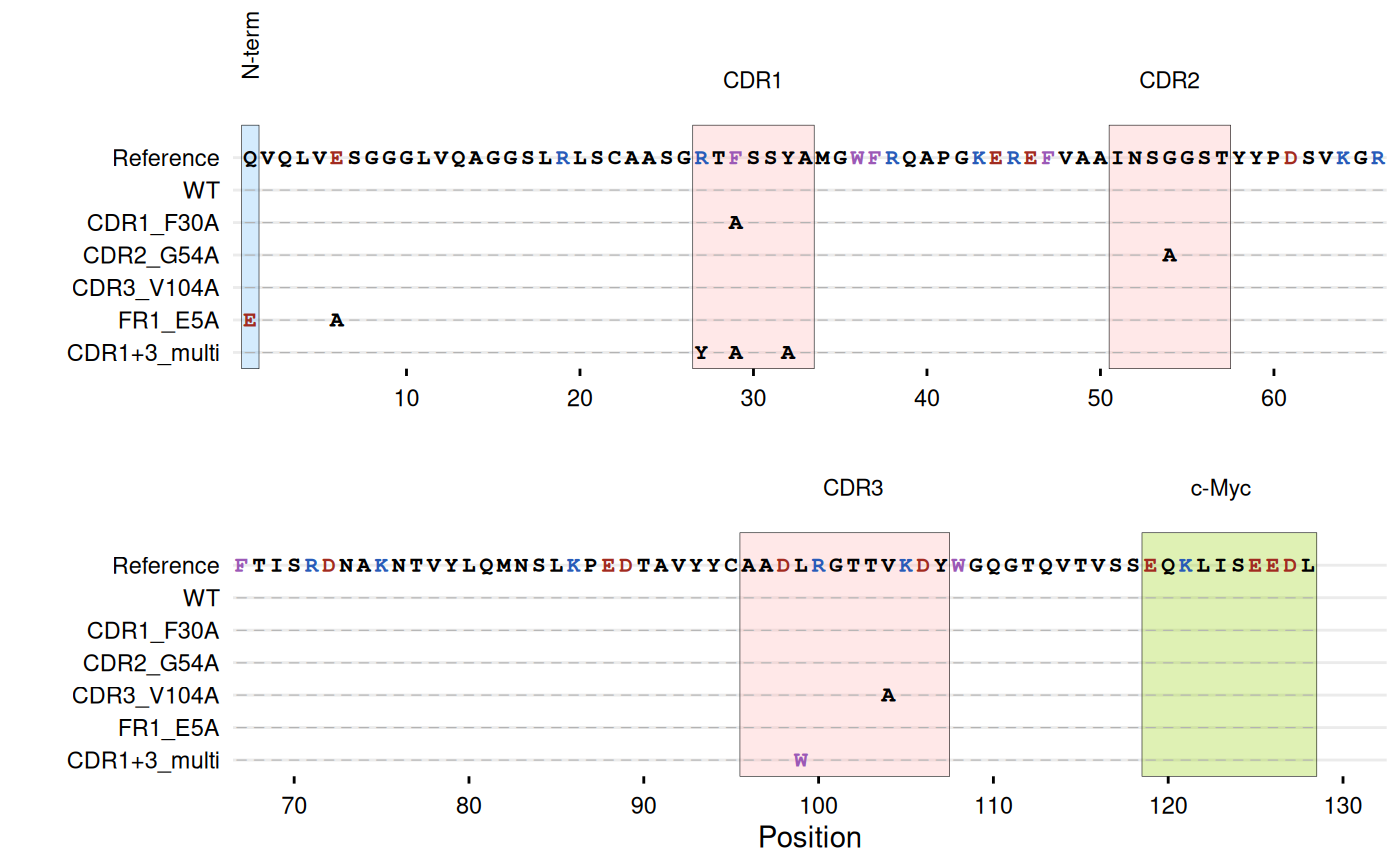
# -----------------------------------------------------------------------
# Example with antibody sequences with CDR mutations
# -----------------------------------------------------------------------
ref_seq <- paste0(
"QVQLVESGGGLVQAGGSLRLSCAASGRTFSSYAMGWFRQAPGKEREFVAAINSGGSTYYP",
"DSVKGRFTISRDNAKNTVYLQMNSLKPEDTAVYYCAADLRGTTVKDYWGQGTQVTVSSEQKLISEEDL"
)
# All sequences must be same length as reference
mutant_df <- data.frame(
sequence = c(
ref_seq, # Wild-type
# CDR1 mutations (27-33)
sub("GRTFSSYAMG", "GRTASSYAMG", ref_seq),
# CDR2 mutations (51-57)
sub("AINSGGS", "AINSAGS", ref_seq),
# CDR3 mutations (96-107)
sub("AADLRGTTVKDY", "AADLRGTTAKDY", ref_seq),
# Framework mutations
sub("QVQLVES", "EVQLVAS", ref_seq),
# Multiple CDR mutations
sub("AADLRGTTVKDY", "AADWRGTTVKDY",
sub("GRTFSSYAMG", "GYTASSAAMG", ref_seq))
),
id = c("WT", "CDR1_F30A", "CDR2_G54A", "CDR3_V104A",
"FR1_E5A", "CDR1+3_multi")
)
# Highlight CDRs and tags, color key residues
gg_seqdiff(
data = mutant_df,
ref = ref_seq,
name = "id",
color = c(R = "#285bb8", K = "#285bb8", # positive
E = "#a12b20", D = "#a12b20", # negative
W = "#9b59b6", F = "#9b59b6"), # aromatic
highlight = list(
"#70bcfa" = 1, # N-terminal
"#ffb4b4" = c(27:33, 51:57, 96:107), # CDRs
"#94d104" = 119:128 # c-Myc tag
),
annotate = list(
list(label = "N-term", pos = 1, angle = 90),
list(label = "CDR1", pos = 30),
list(label = "CDR2", pos = 54),
list(label = "CDR3", pos = 102),
list(label = "c-Myc", pos = 123)
),
wrap = 66
)